


What Is a Good AI Share of Voice? Benchmarks and Targets for 2026
The average AI Share of Voice across industries sits at just 17.2%, according to AthenaHQ's State of AI Search 2026 report. For most brands, that number is either a wake-up call or a starting point. Without a benchmark to compare against, it is just a number. This guide gives you the actual targets: what top-performing brands achieve, how those figures break down by business type and platform, and where the meaningful gaps are.
What AI Share of Voice Measures
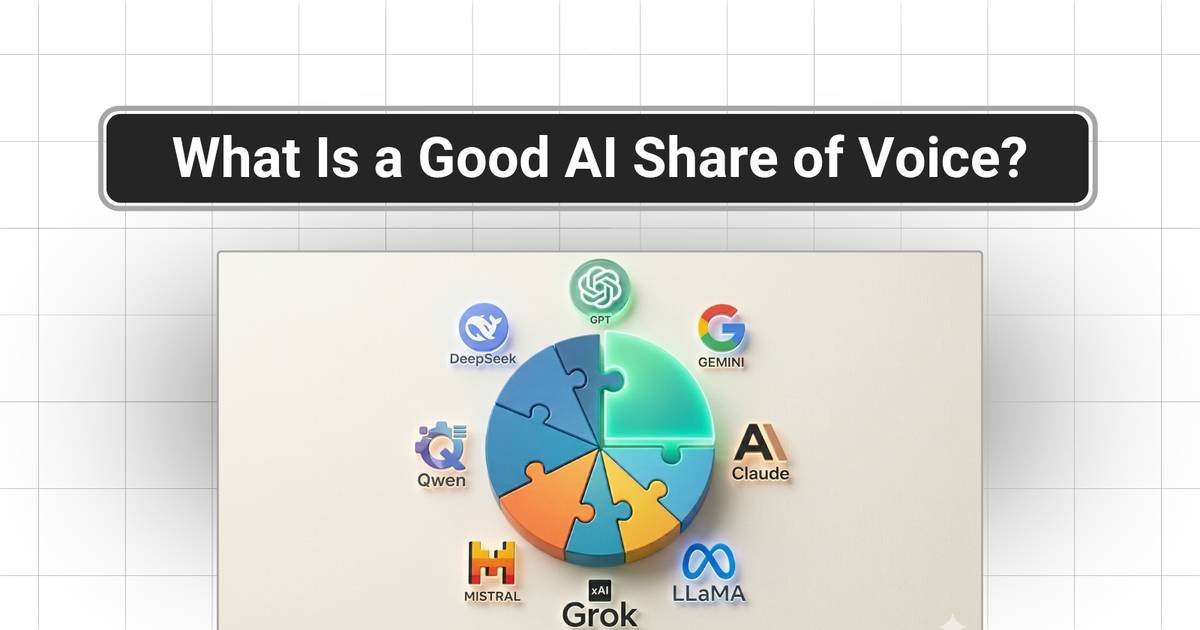
AI Share of Voice is the percentage of relevant AI responses that cite or recommend your brand within a defined competitive set. Calculate it by dividing your brand's mentions by total brand mentions across all tracked competitors in the category, then multiply by 100. Unlike traditional share of voice, which counts paid placements and media pickups, AI SOV measures how often your brand surfaces inside the generated answer itself, regardless of whether the response includes a link.
The 2026 Baseline: Where Most Brands Stand
The industry average is 17.2%, but that figure masks a wide spread. According to Superlines' 2026 AI Search Statistics report, 89% of brands already appear in AI citations in some form, yet only 14% actively track those citations. That gap explains why most teams have no idea whether their score is a problem or a strength.
The spread between strong and weak performers is large. Data-Mania's 2026 AI visibility benchmark found that top-quartile B2B SaaS brands receive 31 citations per month while bottom-quartile brands get 3.7. That is an 8.4x difference within the same category, driven by the same pool of buyer questions.
Benchmark Ranges by Business Type
The right target depends on category breadth and competition density. A niche B2B tool competing against four direct alternatives will reach higher AI SOV percentages than a horizontal platform competing against dozens. These ranges reflect what practitioners observe across real-world monitoring data in 2026.
B2B SaaS
Top-quartile B2B SaaS brands in AI visibility score around 84 out of 100 on aggregated AI presence indexes, with median brands at 62. In share-of-voice terms, 25-35% citation share within a defined competitive set is competitive for horizontal categories. Niche or vertical SaaS with fewer competitors can realistically target 40-55%. Anything below 15% in a category with active competitors signals a citation gap worth closing.
Ecommerce and Consumer Brands
Ecommerce AI SOV benchmarks vary by category breadth. For defined product categories, 20-30% is a realistic target for established brands. The most significant lever for ecommerce brands in AI search is structured product data and review-backed claims: AI engines in shopping contexts strongly favor brands with dense, verifiable product information over those relying on brand recognition alone.
Agencies and Professional Services
Agencies tracking their own AI SOV or their clients' typically aim for 30-40% in tightly scoped service categories. Professional services firms with strong thought-leadership content tend to score above the median, because AI engines favor named experts with verifiable credentials over faceless company pages.
What a Good Score Looks Like, Tier by Tier
Below 10%: Your brand is rarely surfaced for core category queries. The citation gap is significant. Structured content and topic authority are the immediate priorities.
10-20%: Emerging visibility. Your brand appears in some contexts but competitors dominate most conversations. This is where the majority of brands currently sit.
20-35%: Competitive range. You appear consistently in relevant queries and hold a real position in the AI-mediated conversation. This is a defensible position with ongoing GEO effort.
35-55%: Strong visibility. Your brand is cited as a primary reference in the category. Top performers in most verticals operate in this band.
Above 55%: Category-defining. Typically achieved by brands with deep topic clusters, strong E-E-A-T signals, and consistent presence across multiple AI engines. This range requires active monitoring to hold.
Why Your Score Differs Across Engines
One of the most important things to understand about AI Share of Voice is that your score on ChatGPT will not match your score on Perplexity. LSEO's 2026 GEO benchmark found that only 11% of cited domains overlap between ChatGPT, Perplexity and Gemini. A brand that has optimized for one engine may be largely invisible on the others.
Platform behavior also differs fundamentally. Perplexity and Copilot include external links in more than 77% of responses, while ChatGPT does so in roughly 31%. Claude cites or recommends brands in 97.3% of responses, the highest rate of any major model. These differences mean your overall AI SOV figure needs to be broken down by engine before you act on it. A blended average hides where you are actually winning or losing.
The Signals That Separate High-SOV Brands from Low-SOV Brands
The most consistent predictor of high AI Share of Voice is not domain authority or backlink count. Research across benchmark datasets consistently flags named human authorship linked to a verifiable identity as the single most-correlated variable. Brands whose content features real, credentialed authors with a traceable presence (bylines, social profiles, speaking appearances, publications) get cited more often than those relying on anonymous company pages.
Fact density matters too. AI engines favor pages that pack specific, verifiable claims into compact paragraphs, with a data point roughly every 150-200 words. Pages structured with clear definitions, direct answers at the top of each section, and short structured lists are extracted and cited at significantly higher rates than dense narrative content without clear signposting.
How to Track Your AI Share of Voice
Tracking AI SOV manually, by querying ChatGPT and counting mentions, does not scale and produces inconsistent results. The reliable approach is a purpose-built platform that runs standardized prompts across multiple AI engines and aggregates the results. Vizible AI's AI visibility platform tracks brand citations across ChatGPT, Claude, Gemini, Perplexity, Mistral, and DeepSeek, giving you a single view of where you appear and where competitors outrank you.
Frequently Asked Questions
What is a good AI Share of Voice percentage?
For most competitive categories, 25-35% is a solid result. Top-performing brands in focused verticals reach 40-55%. The industry average is 17.2%, so any score above 20% already places a brand in the upper half of its category. Below 10% signals an urgent citation gap.
Does my AI Share of Voice score differ between ChatGPT and Perplexity?
Yes, significantly. Only 11% of cited domains overlap across the major platforms. A brand can have 40% AI SOV on ChatGPT and 12% on Perplexity. This is why blended averages are less actionable than per-engine breakdowns when deciding where to focus GEO effort.
How quickly can AI Share of Voice change?
AI SOV can shift meaningfully within weeks when a brand publishes well-structured content in its category, or when a competitor does. Most practitioners track it monthly to spot trends, with weekly snapshots during active GEO campaigns.
Is AI Share of Voice more important than traditional share of voice?
For brands whose buyers research using AI engines before deciding, yes. AI-referred sessions grew 527% year over year in the first five months of 2025, and 73% of B2B buyers now use AI tools during their research process. In those categories, AI SOV is a leading indicator of pipeline, not just brand awareness.
Start Tracking Your AI Share of Voice Today
Knowing the benchmark is the first step. Knowing where your brand sits relative to it is what drives action. Start your 7-day free trial with Vizible AI and see your citation share across six AI engines in minutes. For specific tactics on moving the number, see our guide to proven tactics for raising your AI Share of Voice.